Karani Dileep Kumar*
Department of Mechanical Engineering, Qis college of Engineering and Technology, Vengamukkapalem-523272, Andhra Pradesh, India
Frontier Research Today, 2019, 2, 2006
Published Online: 26 September 2019 (Article)
DOI: 10.31716/frt.201902006
*Corresponding Author. Email: This email address is being protected from spambots. You need JavaScript enabled to view it. Tel: 91-9666701770
Abstract
The objective of present research work is to investigate the surface morphology, physical and mechanical properties of unidirectional S-glass fiber epoxy composites filled with varying amount of ZnO nanofiller content such as 1 wt%, 2 wt%, 3 wt%, 4 wt% and 5 wt% respectively. ZnO nanofiller was modified with matrix in varying amount using mechanical stirrer and followed by ultrasonication process. The laminate composites were fabricated using a compression molding press technique. Further, laminate composites were subjected to individual characterization and testing in an according to American society for testing and materials standards. The crystalline nature of ZnO nanofiller was studied using X-ray diffraction analysis and surface morphology of ZnO nanofiller on the resin surface was examined by using a scanning electron microscope. The experimental test results revealed that addition of nanofiller content by 1 wt%, 2 wt% and 3 wt% resulted in a gradual reduction of a void fraction by 2.760%, 2.510% and 1.641% respectively and thereafter growth in void fraction increased from 2.696% to 2.833% with 4% and 5 wt% of loading. The flexural and impact strength increased to a maximum of 694.2 MPa and 2550.42 J/m with 3 wt% of loading, with further increasing load content of 4 wt% and 5 wt%, both flexural and impact strength were decreased. Whereas, surface microhardness results showed unique behavior in increased order of 21.6 HV, 24.3 HV, 28.5 HV, 33.7 HV and 38.4 HV with nanofiller loading of 1 wt% to 5 wt%. Thermo-gravimetric test analysis of composites revealed that there was negligible weight loss (%) in composites at 50 ˚C to 380 ˚C. So, composites were thermally stable up to 380 ˚C. Further heating of composites from 380 ˚C to 900 ˚C, the majority of weight loss (%) incurred in composites which were nearly half of the weight loss (%).
Keywords
Nanofiller; Cluster mechanism; Void fraction; Flexural; Impact; Microhardness
1 Introduction
Glass fibers such as S-glass fibers are synthetic fibers and predominantly used in high strength applications (aircraft body parts, boat hulls, insulation cables, etc.) due to its incombustibility nature, resistance to heat, deformation and electricity. These fibers are typically less brittle, highly flexible at room temperature and inexpensive than carbon and aramid fibers1,2. S-glass fibers are light-weight and are highly resistant to acids and moisture. It contains SiO2 as major constitute (65 wt%) which imparts low thermal expansion and stable performance at elevated temperatures to the fibers3. Virgin S-glass fiber has properties such as density (2.49 g/cm3) and stiffness (70-80 GPa) that are equivalent to pure aluminum, it’s tensile strength (UTS 4700 MPa) fifteen times greater than heat-treated aluminum alloys such as AA6061-T6 (UTS 310 MPa)4-6.
Glass fiber epoxy composites are a classic variety of engineering materials and are extensively used in marine, aerospace, automotive, sports and construction as structural composites7,8. These composites are well known for low creep, good thermal and dimensional stabilities9. But, due to irregular uncross-link chain structures (three dimensional) present in the matrix, composites have low impact and toughness strength, these chain structures cause composites to shrink at elevated temperature and loose its dimensional stability. At heavy mechanical loads, induced stresses cause to break down the chain structure and results in micro-cracks initiation in the matrix as shown in Figure 1(a)10,11. During the curing process and fabrication route, voids (empty spaces) are formed in the interface layers and develop some modes of failure in the composites such as de-bonding and de-lamination as shown in Figure 1(b). These defects reduce composites properties and durability (working span)12.
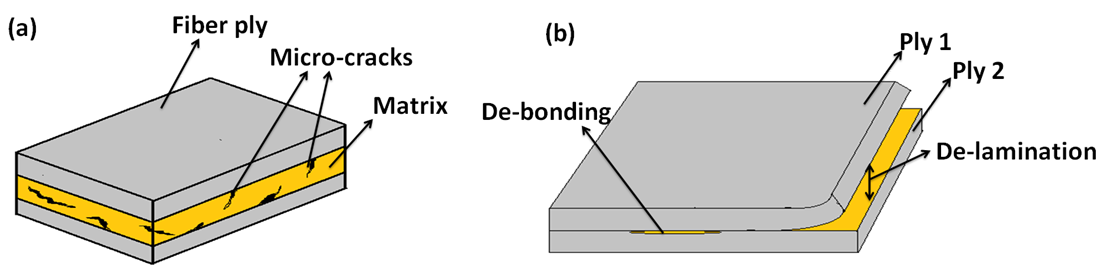
Figure 1. Illustration of failure modes in the composites (a) Micro-cracks in the matrix (b) De-bonding and De-lamination in the interface layer.
To avoid the composite from failures, suitable reinforcing agents should be applied to the matrix, which gives the additional properties that, the composite need13. Matrix modification is one of the processes to strengthen the matrix phase and improve the composite’s properties14. This matrix modification process can be done by reinforcement of the second phase mainly (Nano-tubes, Nano-wires, Nano-particles, etc.) to the matrix, which can alter mechanical, physical and chemical properties15,16. Reinforcing the matrix with the secondary phase, alter its multifunctional properties due to the physical interaction between them17. Since the fillers are in nano-level, they occupy the large surface area to given surface volume, so the amount required (wt%) to obtain the mechanical properties are lesser than that of traditional fillers18.
The loading content of nanofillers considered as an important factor for composites fabrication19. The specific weight fraction of nanofiller content mainly depends on the type of composite material, filler size, and resin content20-22. Research works found out that, as a weight fraction of nanofiller content increases in the matrix beyond specific weight fraction level (wt%), there is a sharp decline in mechanical properties of composites, this is due to the formation of irregular clusters which results in uneven distribution of stresses in the matrix23,24. However, nano-size fillers are hard to disperse uniformly into the resin manually (hand stirring)25. Recent advances show that ultrasonication is one of the dispersion methods used to obtain uniform filler dispersion26-28. Research studies indicate that properties of composites were mainly depending on series of factors such as aspect ratio of particles, degree of filler orientation, filler size, filler content (wt%) and homogeneity of filler dispersion29-32.
Till now, some research works shown that, tensile, impact and flexural properties were greatly enhanced by nano-sized particles, while micro-size particles may act as cracks initiator and gives poor bonding in the interface zone and were responsible for de-bonding, de-lamination and also significantly effects the various properties such as fatigue, wear, etc33,34. Presence of high aspect ratio nanofillers will induce more stress concentration in interface layers and impart brittle nature to the composite35. Sushil Kumar Singh et al.36 investigated that, incorporation of TiO2 filler (1, 2, 3, 4, 5, 6 & 7 wt%) to the epoxy polymer and found increase in tensile strength by 32.56 % for 4 wt% of TiO2, with further increase of TiO2 (5, 6 & 7 wt%), there was a sharp decline in tensile strength due to formation of uneven clusters or agglomerations. M. J. Pawar et al.37 identified that, for better improvement of surface microhardness in jute fiber epoxy composites, granite powder was reinforced into the resin by 8, 16 and 24 wt%. It was identified that microhardness of granite powder reinforced composites showed a substantial increase of hardness with granite powder loading. This was due to decreased voids and air bubbles in the matrix and that also inter-particulate distance decreased in the matrix with loading, which creates resistance to penetration by indentation loads.
Vishnu Prasad et al.38 studied that, loading of nano TiO2 filler content to flax fiber reinforced epoxy composites by 0.5, 0.7 & 0.9 wt%, flexural strength was gradually increased from 76.11 to 88.77 MPa for 0.5 and 0.7 wt%, but for 0.9 wt% flexural strength was decreased to 80.11 MPa this was due to clusters which may easily form for nano-particles at higher loading content results in reduction of inter-particulate distance between them as a result flexural strength reduced due to brittle nature. Sandhyarani biswas39 investigated that, loading of SiC content to the bamboo-epoxy composites by 0, 5, 10 and 15 wt% found out that, void fraction gradually decreased from 5.69 to 3.91% for 0 and 5 wt%, with further loading of SiC wt%, void fraction increased from 4.35 to 7.95% for 10 and 15 wt%, this reverse trend in composites were mainly due clusters of SiC particles which led to the formation of voids in interfaces gaps.
Till now some previous research works carried out on physical, mechanical and tribological properties of glass fiber epoxy composites with reinforcement of titanium-oxide, nano-silica, nano-clay and zirconia as particles40-45. In the present work, ZnO (20-40 nm) was selected as reinforcement to the matrix, because of its excellent properties such as thermal, chemical and photo-stability and can be used as multi-functional material. ZnO is one of the promising materials used in a wide range of applications46. However, no preliminary research works have been taken up that, how ZnO can influence the unidirectional S-glass fiber epoxy composites properties. The present research work aim is to develop the composites with varying load content of ZnO as reinforcement into the matrix with S-glass fiber by compression molding press technique and to investigate the surface morphology, physical and mechanical properties of composites.
2 Experimentation details
2.1 Materials
The primary reinforcement material such as glass fiber used in the present fabrication of composites and it is in the form of unidirectional S-glass fiber mat (450 GSM) having a thickness and density of 0.5 mm and 2.49 g/cm3 as shown in Figure 2. S-glass fiber material was commercially procured from Jushi Pvt. Ltd, India. In the present fabrication work matrix materials such as LY 556 Epoxy (Diglycidyl ether of bisphenol-A) and HY 951 Hardener (Triethylenetetramine) with densities of 1.15 and 0.97 g/cm3 were selected. Matrix materials were collected from Huntsman Pvt. Ltd, India. The Secondary reinforcement material such as Zinc-Oxide (ZnO) with particle size and density of 20-40 nm and 5.606 g/cm3 was selected to the matrix modification and this ZnO (nanofiller) was supplied by Nano Labs Pvt. Ltd, India.
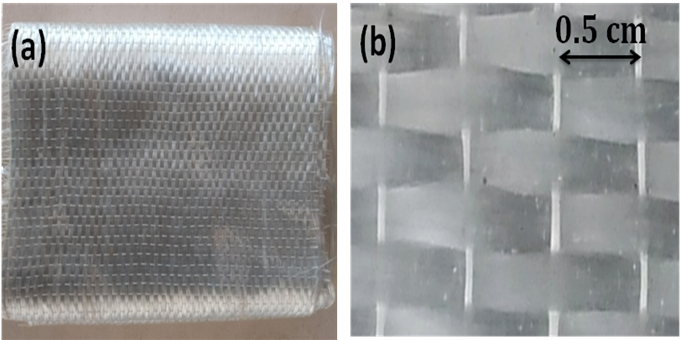
Figure 2. Unidirectional S-glass fiber mat (a) Photographic view; (b) Magnified view.
2.2 Fabrication of laminate composites
Initially, continuous S-glass fiber mat was cut into the dimensions of 300 mm × 300 mm (length × width), this was done to obtained 6 fiber mats of equal dimensions for each composite. The stoichiometry weight ratio of epoxy and hardener were taken in a 10:1 ratio by the manufacturer’s specification. Composites designation and its chemical composition are mentioned in Table 1.
Table 1. Composites designation and its chemical.
|
Composite ID |
Chemical composition |
|
Neat resin |
S-glass Fiber mat 50 wt% + Matrix 50 wt% |
|
C1 |
S-glass Fiber mat 50 wt% + Matrix 49 wt% + ZnO 1 wt% |
|
C2 |
S-glass Fiber mat 50 wt% + Matrix 48 wt% + ZnO 2 wt% |
|
C3 |
S-glass Fiber mat 50 wt% + Matrix 47 wt% + ZnO 3 wt% |
|
C4 |
S-glass Fiber mat 50 wt% + Matrix 46 wt% + ZnO 4 wt% |
|
C5 |
S-glass Fiber mat 50 wt% + Matrix 45 wt% + ZnO 5 wt% |
Further, obtained weight quantities (wt%) of S-glass fiber mat, matrix, and nanofiller for each composite type, a selective quantity of epoxy was heated at 65 ˚C for 1hr at to lower the viscosity of liquid and then degasification for 20 min in a vacuum oven at 65 ˚C. Further on, varying wt% of ZnO nanofiller was measured by using an electronic weighing machine. This weighed ZnO content was mixed into the epoxy by using mechanical stirrer at 500 rpm for 30 min and subsequently followed by ultrasonication process for 20 min with 20 kHz. Ultrasonication process time was increased with increasing of ZnO content for better uniform dispersion47. The hardener quantity (wt%) was slowly and steadily added into the epoxy and mixed for 2 min by manual stirring using as the wood stick. This mixture of a liquid matrix with varying wt% of ZnO is then applied on the glass fiber layers.
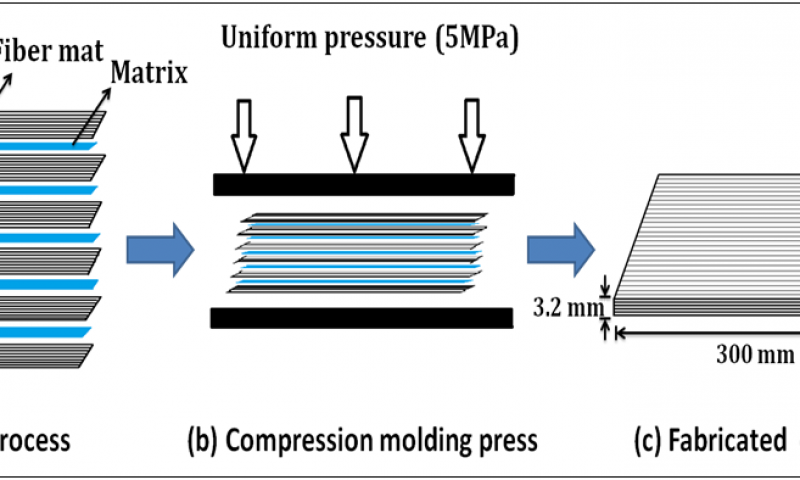
Compression molding press is one of the fabrication techniques adopted for laminated composites48. In this technique, the liquid matrix was uniformly applied on one side of the fiber surface mat by using a roller brush. The second layer of fiber mat was placed on the first layer of liquid matrix surface mat and compressed with mild pressure using a roller brush to remove the excess matrix in the interface zone. This technique was repeated for 6 layers with 0˚ orientation along fibers direction for each composite and this was to be done till the required fiber layers were tightly stacked, then the composite was placed on the mold die and compressed with uniform pressure of 5 MPa with a temperature of 100 ˚C for 15 min49, are schematically illustrated in Figure 3.
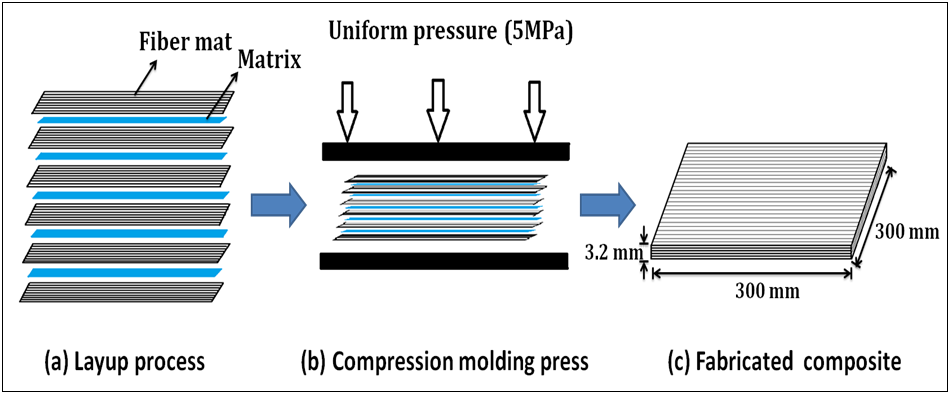
Figure 3. Schematic illustration of the fabrication technique process for laminate composites.
The variable wt% of ZnO laminate composites with uniform thickness were then subjected to the curing process at room temperature for 48 hrs. However, still aromatic amines (hardener compound) are less reactive with epoxy at room temperature so, composites were placed in an adjustable mould with holes to restrict the composites alignment and slope during the curing process and then subjected to post-cure in a hot air oven at 80 ˚C for 4 hrs to strengthen the cross-link chain structures in the matrix50. Finally, composites were prepared for individual characterization and testing in an according to ASTM standards.
3 Characterization techniques of laminate composites
3.1 X-ray diffraction analysis (XRD)
ZnO nanofiller was characterized by using Ringaku MiniFlex 600. Cu Kα X-ray source wavelength was operated at a voltage of 40 kV and a current 20 mA. The continuous scanning mode 2θ was selected with a scan speed rate of 2˚/min. ZnO nanofiller mean crystallites size at peak diffractions were calculated from the Debye-Scherrer method by using the following Eq. (1)51:

where D is the mean crystallites size (nm), k is the dimensionless shape factor ( = 0.94 for FWHM of spherical crystals with cubic symmetry), λ is the X-ray source wavelength of 1.54 Å, β is the Full Width at Half Maximum (FWHM) and θ is the Bragg’s diffraction angle.
3.2 Scanning electron microscope (SEM)
In order to study the surface morphology of variable wt% of ZnO on the resin surface, laminate composites were cut into the required dimensional area of 10 mm × 10 mm (length × width). Later, prepared specimens were examined by using scanning electron microscope (ZEISS EVO 18). The specimens were mounted on the aluminum multi-pin stubs using carbon tape. The instrument was operated with an accelerating voltage of 15.00 kV.
3.3 Density and void fraction
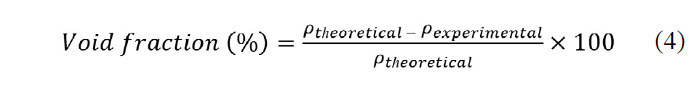
Void fraction is one of the important characterizations done on polymer composites, which determines the composite quality and span52. The void fraction of composites were obtained by using the following equations.
Theoretical density (without voids) of fabricated composites was obtained from Eq. (2)53.

where wfib, wmat, and wfil are the weight fraction of fiber, matrix, and nanofiller, ρfib, ρmat and ρfil are the density of fiber, matrix and nanofiller.
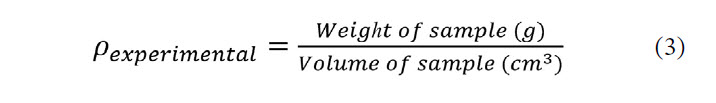
Experimental density (with voids) of fabricated composites was obtained from Eq. (3)54.
The void fraction in composites was obtained from using Eq. (4)55.
3.4 Mechanical characterization
Mechanical tests were performed on the composites specimen to assess the significance of ZnO nanofiller content in the composite. To obtain flexural strength of composites, the specimen of 127 mm × 12.7 mm × 3.2 mm (length × width × thickness) was prepared according to ASTM D790 and was tested on ZWICK-ROELL Z020 with crosshead test speed of 1.5 mm/min at room temperature. To conduct Izod impact toughness test on composite specimens, the specimen of 64 mm × 12.7 mm × 3.2 mm (length × width × thickness) with 2.54 mm central depth of V-shaped notch with 45˚ was prepared according to ASTM D256, all the impact test specimens were conducted on the ZWICK ROELL HIT 50P with an experimental impact velocity of 2.9 m/s at room temperature. To conduct Vickers microhardness test, specimens were prepared into the required dimensions later indentations were performed at 15 different locations on specimen surface for obtaining mean microhardness with an applied indentation load of 100 gf and dwell time of 15 sec in an according to ASTM E384.
3.5 Thermal characterization
Thermal stability of fabricated composites was examined by conducting thermo-gravimetric analysis (TGA). This test was carried out on the PERKIN ELMER TGA 4000 with each specimen weight of 10 mg in a closed atmosphere chamber with nitrogen gas flow rate of 60 ml/min in an according to ASTM E1131. In this test method, specimens were subjected to different controlled temperature ranges. Specimens were heated at a temperature range from 50˚ - 900 ˚C at 20 ˚C/min. This test determines the characteristic of weight loss (%) in the composites with the function of temperature variations in a closed controlled atmosphere.
4 Results and Discussions
4.1 X-ray diffraction analysis of ZnO nanofiller
4.1.1 ZnO peak indexing
X-ray diffraction analysis was conducted on the ZnO nanofiller to characterize the crystalline nature. Figure 4 shows the diffraction peaks of nanofiller at various scanning angles in the XRD pattern.
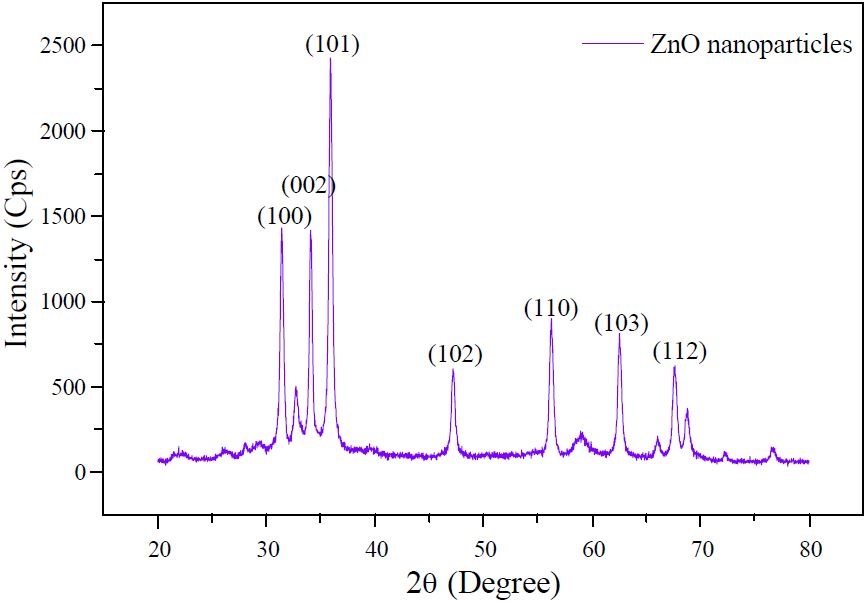
Figure 4. X-ray diffraction peaks of ZnO nanofiller at various scanning angles.
It is perceived from the Figure 4, the XRD pattern of ZnO nanofiller showed all the characteristic diffraction peaks obtained were consistent with the patterns observed with that of hexagonal wurtzite structure with ZnO space group of P63mc (186) or C46v and space lattice constants (lattice parameters) of a = b = 3.249 Å, c = 5.207 Å and c/a = 1.602 Å. The obtained XRD pattern which was in good arrangement with JCPDS data (card no. 01-089-0510), and confirmed the hexagonal wurtzite phase of ZnO56. In Figure 4, seven strong diffraction peaks of ZnO were observed at 2θ values of 31.391˚, 34.075˚, 35.878˚, 47.178˚, 56.191˚, 62.465˚ and 67.573˚ corresponding to the space lattice planes (hkl) of (100), (002), (101), (102), (110), (103) and (112) respectively. It is also observed that sharp and narrow broad varying diffraction peaks in the XRD pattern were attributed to good crystalline nature of ZnO. Hence, there was no evidence for remnant micro and foreign particles in as bought ZnO. Mean crystallites size of ZnO at strong peak diffractions were calculated by using the Debye-Scherrer equation. Mean crystallites size, d-spacing and space lattice plane at strong diffraction peaks of ZnO are mentioned in Table 2.
Table 2. Mean crystallites size, d-spacing and space latticeTable 2. Mean crystallites size, d-spacing and space latticeplane of ZnO at strong diffraction peaks.
|
Material |
Peak/2θ (deg) |
FWHM (deg) |
Space lattice (hkl) |
d-spacing (Å) |
Mean crystallites (nm) |
| ZnO |
31.391 |
0.353 |
(100) |
2.846 |
24.43 |
|
34.075 |
0.282 |
(002) |
2.622 |
30.77 |
|
|
35.878 |
0.364 |
(101) |
2.500 |
23.96 |
|
|
47.178 |
0.340 |
(102) |
1.924 |
26.63 |
|
|
56.191 |
0.387 |
(110) |
1.635 |
24.29 |
|
|
62.465 |
0.343 |
(103) |
1.485 |
28.28 |
|
|
67.573 |
0.375 |
(112) |
1.384 |
26.62 |
4.1.2 Estimation of lattice-strain (induced-strain) by Williamson-Hall (W-H) analysis
In this Williamson-Hall analysis approach, the induced-stain from the peak broadening of ZnO crystallites can be evaluated by considering the Uniform Deformation Model (UDM)57. Referring to the Williamson-Hall approach, narrow broad varying peaks of ZnO crystallites in the XRD pattern were caused due to the contribution of varying crystallites size and induced-strain. However, from the uniform deformation model by Williamson-Hall, the induced-strain (ε) in the narrow broadening peaks was mainly due to lattice plane structure distortion and dislocation which arises from the imperfection of ZnO crystallites and this can be calculated by using Eq. (5)56:

From the mentioned Eq. (1) and (5), it was identified that the peak width of ZnO crystallites size (D) varies as 1/cosθ and the strain (ε) varies as tan θ. Total narrow peak broadening (βhkl) of the individual Cauchy profile is indexed by the sum of the crystallites size (βD) and induced-strain (βε) and this can be represented as Eq. (6)57:
![]()
It was assumed that the crystallites size and induced-strain contributions are independently each other to the formation of the strong narrow peaks in the XRD pattern, also perceived that both are forming an overlap Cauchy-like profile, so the observed Cauchy profile line breadth is the sum of Eq. (1) and (5) and given as Eq. (7)56:

By rearranging the above Eq. (7) we get the Eq. (8):

The above Eq. (8) is the Williamson-Hall equation; from the Eq. (8) we assumed that induced-strain is uniform in the entire crystallographic directions and known as uniform deformation model. In this model, crystallites are considered as isotropic behavior and it is assumed that properties of crystallites are independent along the direction which is considered to be measured. The values βhklcosθ on the y-axis were plotted with the function of 4 ε sinθ on the x-axis and forms the linear fit with respect to the given experimental data. The induced-strain (ε) in the strong diffraction peaks was estimated from the negative slope of the linear fit as shown in Figure 5. Overall, it was observed that there is an induced-strain of -3.1125×10⁻⁴ in the strong peaks of ZnO crystallites and also that negative linear fit indicates the lattice shrinkage in the crystallites and further this can be fully evaluated by the calculation of lattice parameters56.
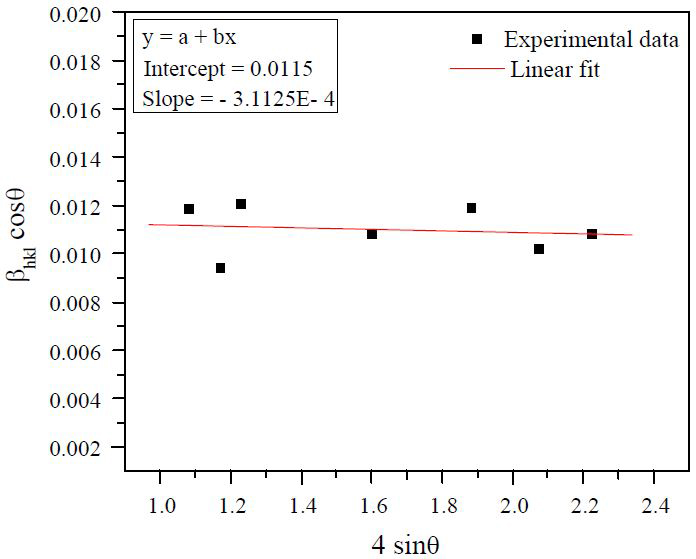
Figure 5. The Williamson-Hall plot of induced-strain in peak broadening of ZnO.
4.2 Surface morphology of ZnO nanofiller on the resin surface
Surface morphology of ZnO nanofiller on the resin surface was examined by using ZEISS EVO 18 scanning electron microscope (SEM). Figure 6 shows the dispersion state of varying ZnO nanofiller on the resin surface.
It is observed from the above SEM images of resin surface with 1 wt% and 2 wt% of ZnO nanofiller, that they have almost homogenous, uniform dispersion and spherical shaped structure on the resin surface as shown in Figure 6 (a) and 6 (b). The main reason for uniform dispersion on the resin surface was due to optimal ultrasonication method and also low nanofiller loading content (wt%). At such a low wt% of loading, nanofiller occupies sparsely area to the given surface volume in the resin, hence there are negligible van der Waals interactive forces (physical force) between the nanofiller, so this helps in uniform dispersion thereby retaining the uniform shape and size (aspect ratio). Further, loading ZnO nanofiller content to 3 wt%, it is observed from the Figure 6 (c) that, there was a variation in the nanofiller shape and size due to interaction of nanofiller with each other and form small cluster groups in sparsely area, and also that nanofiller diameter was slightly increased to micron level due to collision. It is also perceived from Figure 6 (c) that, the addition of 3 wt% of ZnO nanofiller to the resin, results in good dispersion and reduces the possible formation of voids, thereby improving the interfacial bonding strength between each fiber laminate. Further loading ZnO content to 4 wt%, it is observed from the Figure 6 (d) that, the nanofiller occupies short inter-particulate distances because of less surface area to volume ratio in the resin and they start to agglomerate and overlap with each other due to high van der Waals interactive forces between the nanofiller as shown in Figure 7. This results in the formation of high aspect ratio particles and causes inhomogeneous distribution with clusters. Further loading to 5 wt%, inter-particulate distance becomes lesser than that of 4 wt% resulting in the formation of large and big uneven continuous clusters, these clusters will collide with other clusters and form voids in the collided interface area as shown in Figure 6 (e). Overall, it is observed from 4 and 5 wt% of nanofiller loading to the resin, (ⅰ) There was difference in the size of the clusters (ⅱ) Reduction of inter-particulate distance between the nanofiller (ⅲ) There were voids in interface area of collided clusters on 5 wt% loading on the resin surface.
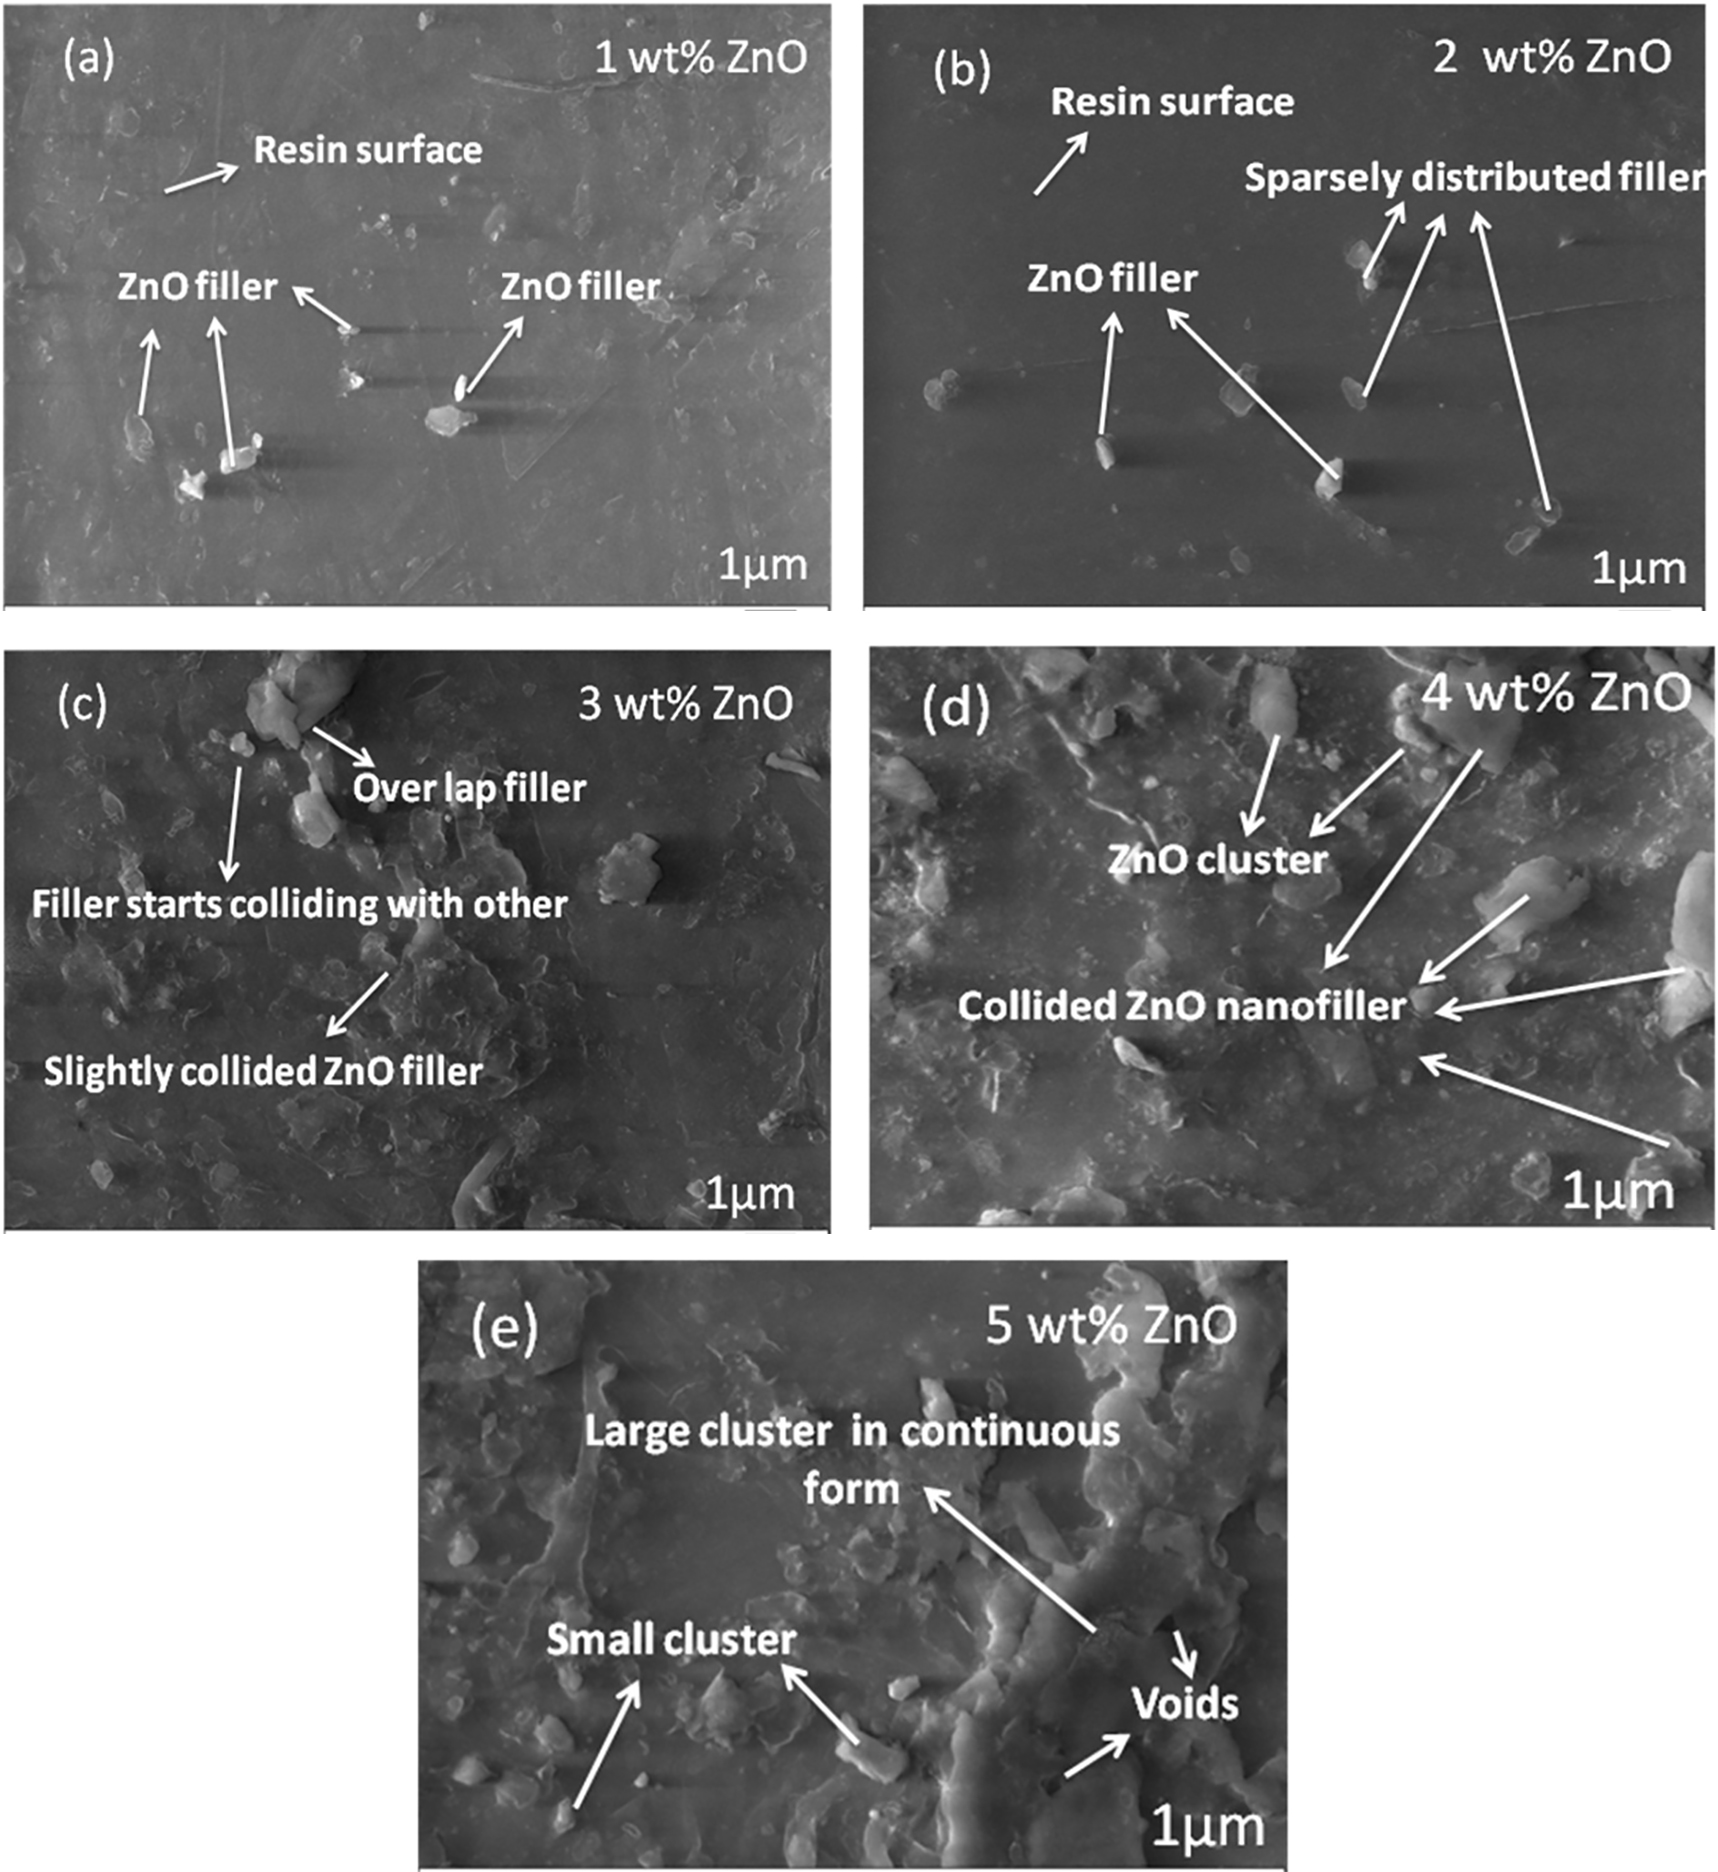
Figure 6. Dispersion state of ZnO nanofiller on the resin surface (a) 1 wt% ZnO (b) 2 wt% ZnO (c) 3 wt% ZnO (d) 4 wt% ZnO (e) 5 wt% ZnO.
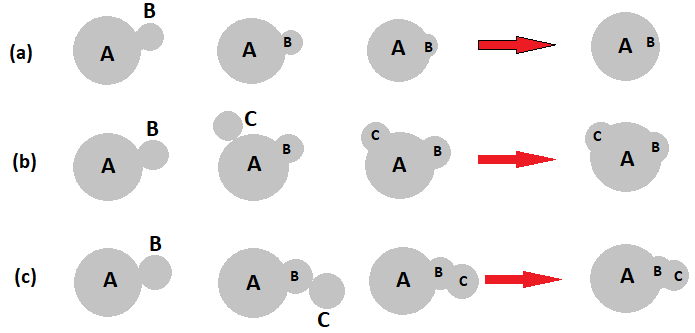
Figure 7. Illustration of different mechanisms of cluster formation in the resin via ultrasonication process.
4.2.1 Effect of ZnO morphology by cluster growth mechanism
In the cluster growth mechanism, the properties of nanoparticles are decided by their structure resulting in the formation of actual particle growth. Overall from the SEM research work scenario, it was identified that clusters generation have a strong influence on the ZnO (wt%), type of stirring process and the stirring time. According to the available SEM images with variable wt% of ZnO, it was considered that low wt% have the negligible clusters this means that particles have enough space to occupy in the epoxy volume without interactive forces (van der Waals forces) between them. As wt% increases, it was noted that individual nanoparticles start to hit by one another resulting in the formation of clusters, later more and more clusters were formed with given wt% by collision effect due to reduced volume ratio (particles volume/epoxy volume). The generated clusters have more surface volume than individual nanoparticles, hence increased surface clusters have more interactive physical forces to attract the more individual nanoparticles and neighboring clusters. Cluster to cluster collision in reduced volume ratio area in epoxy during ultrasonication which may lead to the formation of agglomeration or coalescence which its size is bigger than the generated cluster. In this work, clusters mechanism can be explained by the diffusion process of the nanoparticles as shown in Figure 7. In first mechanism (a) process, the surface of the particle B attract the cluster A by gravity or van der Waals forces, gradually particle diffuses or merges into the cluster. Whereas in the mechanism (b) process, individual particles such as B and C collide the surface of the cluster at a time and slowly particles surface partially merges into the cluster which leads to the bigger cluster. But in the mechanism (c), first individual particles B will attract the surface of cluster later particle C collide the surface of the particle B eventually all together merges with each other which forms the large and uneven cluster as shown in Figure 7. Overall, from the work we investigated that coagulation of the particles has a great effect on the time it means that after the ultrasonication process the particles are settling down due to gravity and diffusion effect. In this process, particles will collide each other by different cluster mechanism. So, the time during the sonication and after the sonication process is also one of the important factors for the formation of clusters.
4.3 Density and void fraction
Void fraction is an important consideration in composites and it has a strong influence on physical, mechanical and tribological properties58. The measured theoretical density, experimental density and void fraction of fabricated composites with varying wt% of ZnO loading are shown in Figure 8 and Figure 9.

Figure 8. Theoretical and experimental density of fabricated composites on ZnO nanofiller loading.
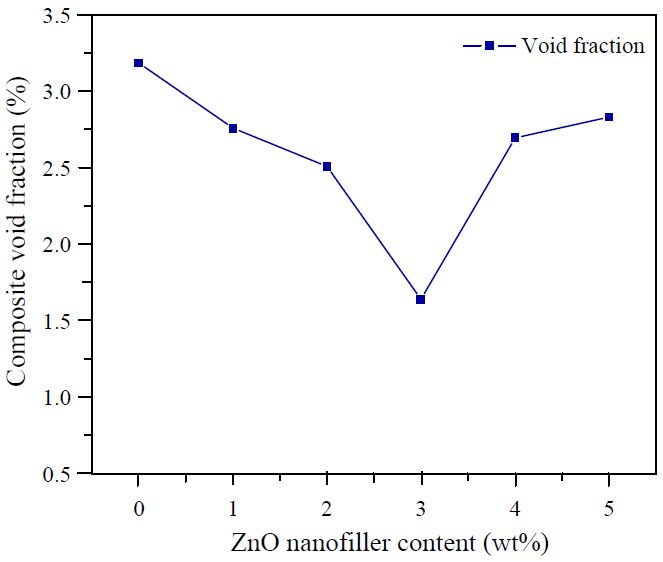
Figure 9. The void fraction of fabricated composites on ZnO nanofiller loading.
It is clearly observed from the Figure 8, each composite has different theoretical and experimental density these are mainly due to the presence of non-uniform voids and matrix pores in stacked interface layers. So, these defects were mainly responsible for the reduction of weight and density in composites59. Overall it is identified from the Figure 8, the experimental density of composites gradually increased from 0 to 5 wt% of loading, because of the density differences between glass fiber (2.49 g/cm3), ZnO nanofiller (5.606 g/cm3) and matrix density (1.06 g/cm3). While loading nanofiller content to composites, ZnO content (wt%) is gradual increases as a result matrix content slightly decreases (in the required proportionate manner) hence, ZnO impart more density to composite and eventually there is an increasing density variation in composites with nanofiller loading. Overall from Figure 9 it is observed that, neat resin composite showed the highest void fraction of 3.186% with no addition of nanofiller content, high void fraction in the neat resin composite was mainly attributed to entrapped air in manufacturing route (pressure, temperature variation) and presence of volatile organic compounds (alcohol, amine and ether groups) which become vapors or gases during curing stage in the matrix which results in the formation of empty spaces (air pockets or voids) in the matrix60. Further loading of nanofiller content from 1 to 3 wt% to composites, it is perceived that void fraction gradually reduced from 2.760 to 1.641% in composites. Therefore, decreased void fraction in composites was mainly due to ZnO nanofiller content, this nanofiller content in the matrix occupies the air gaps and also reduce the formation of voids in interface zones. Further loading nanofiller content from 4 to 5 wt%, void fraction start increased from 2.696 to 2.833% in composites. It is also observed that at 4 wt% loading, there may be a generation of micro-voids in interface layers due to the increased aspect ratio of particles and clusters61. Further loading to 5 wt%, nanofiller turn in to micro-filler by collision and thereby increases in the formation of more uneven clusters in stacked zones than 4 wt%. These clusters in the interfacial layers create more air pockets. Hence, clusters were responsible for the increment of void content in composites.
4.4 Flexural test results and analysis
Three-point flexural bend test was conducted on the test specimens to investigate and analyze the mechanical effect of ZnO nanofiller content in the composites. The flexural strength, modulus, and stress-strain behavior on ZnO nanofiller content in composites are shown in Figure 10 and Figure 11.
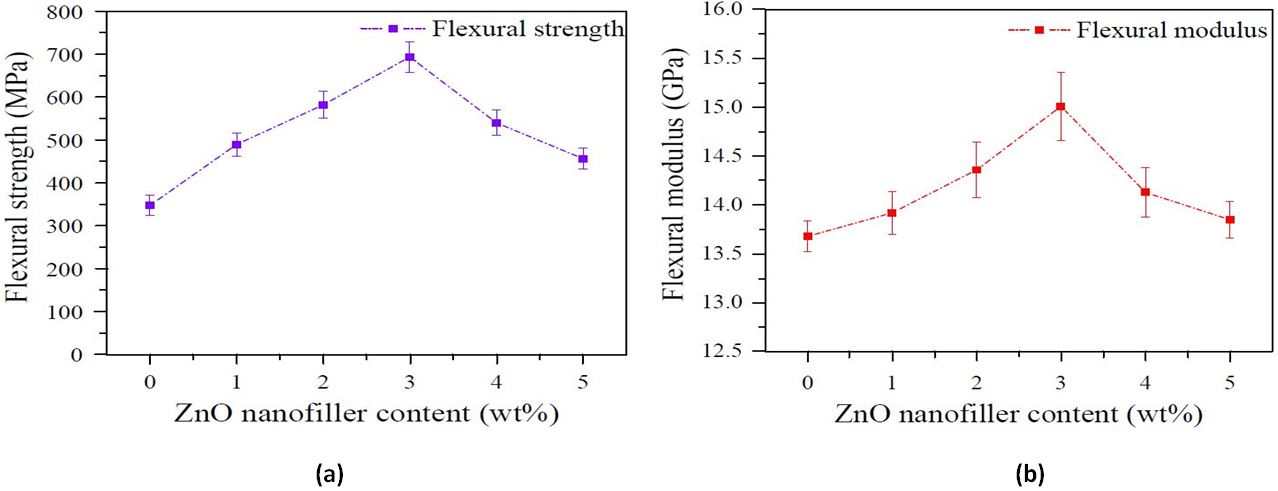
Figure 10. The behavior of flexural results on ZnO nanofiller loading (a) Flexural strength (b) Flexural modulus.
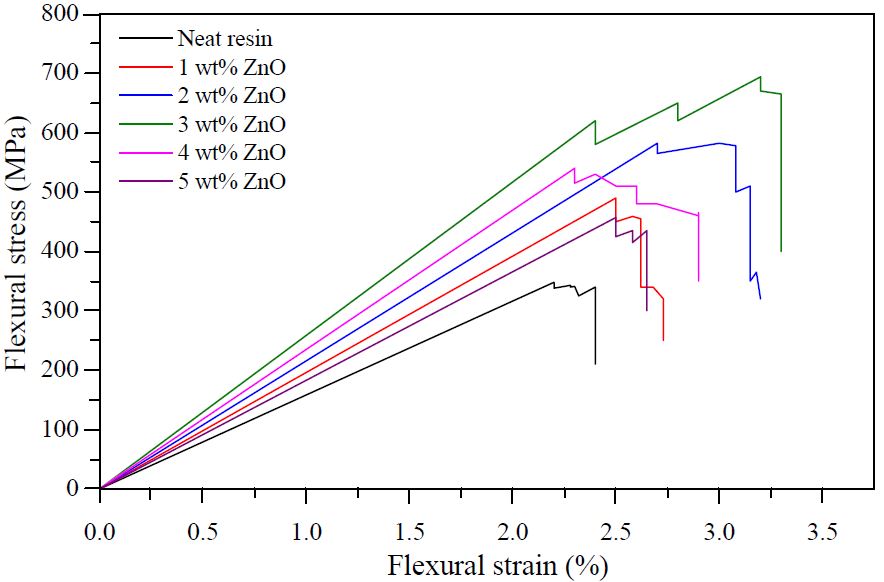
Figure 11. Stress-strain behavior of flexural test specimens on ZnO nanofiller loading.
It is clearly identified from the Figure 10, neat resin composite showed the lowest flexural strength and modulus of 348.2 MPa and 13.68 GPa. Thereafter, as wt% of nanofiller reinforcement increased from 1 to 5 wt%, it is observed that flexural strength and modulus were reached the highest value of 694.2 MPa and 15.01GPa with nanofiller content of 3 wt%. Flexural strength and modulus were increased from 490.51 to 694.22 MPa and 13.92 to 15.01 GPa with an improvement of 41.53%, while modulus showed 7.83% of improvement in composites. The significant improvement in the flexural strength and modulus were observed at 3 wt% of loading. The matrix modification with reinforcement of ZnO nanofiller showed enhanced flexural strength and modulus results in composites at certain wt%. These improved test results were mainly attributed to the incorporation of ZnO nanofiller into the matrix which led to better adhesive bonding strength between the nanofiller, fibers, and matrix, resulting in the gradual increase of load transfer rate interaction between the nanofiller, matrix and glass fiber62,67. It is also identified that at low wt% of reinforcement (1 to 3 wt%), collision rate of nanofiller in the matrix was negligible. Hence, with this it can imagine that there was no generation of high aspect ratio particles or clusters by collisions of nanofiller so, this results there may be less chance of generation of localized point stress concentration in the matrix. In Figure 10, flexural strength and modulus results were increased at certain wt% (1 to 3) of nanofiller reinforcement, this improvement may be assigned to the proper functioning of nanofiller with matrix and fibers, leading to transfer of bending stresses (compression and tension) in aligned uniform distribution across all the stacked layers63. Further, as wt% of ZnO nanofiller loading from 4 to 5 wt%, flexural strength was gradually decreased from 694.22 to 457.32 MPa with strength reduction of 34.12% and modulus was decreased from 15.01 to 13.85 GPa with reduction of 7.72% in composites. Hence, this reverse effect of decreased flexural strength and modulus in composites were mainly due to high van der Waals interactive forces between the nanofiller in the matrix during ultrasonification process, which forms agglomerations or clusters of nanofiller and imparts brittle nature to the matrix64,67. These clusters of nanofiller reduce the active surface area in the resin, resulting in the exhibition of ineffective load transfer rate between the matrix and fibers (interface zones). It is also evident that, irregular clusters in the matrix act as points for localized stress concentration and this in-turn to reduce the elasticity nature of composites. Void content is also one of the factors for reduced flexural strength and modulus because, at higher flexural loads, voids start to open and help in crack generation thereby reducing flexural strength and modulus in composites65.
4.5 Impact test results and analysis
After conducting the Izod impact toughness test, the impact strength of specimens was analyzed and compared with each other to understand the importance and influence of matrix modification with ZnO nanofiller content in composites. The behavior of impact strength and absorbed energy on varying ZnO nanofiller loading in fabricated composites are shown in Figure 12.
It is clearly identified from the Figure 12, the variation of impact strength was identified with nanofiller loading and also that there was a remarkable difference in the impact strength of each composite. Figure 12 shows the impact strength and absorbed energy results as follow a similar trend to that of flexural strength and modulus results. Overall from the test results, it is observed that neat resin composite showed the lowest impact strength and the absorbed energy of 1381.56 J/m and 4.21 J with no addition of nanofiller content. Further, on loading ZnO nanofiller content from 1 to 3 wt%, the impact strength and absorbed energy in composites were substantially increased from 1711.87 to 2472.50 J/m and 5.47 to 7.95 J resulting in 44.43% of impact strength improvement, while the absorbed energy show 45.33% of improvement. This increment was due to the increase of nanofiller loading which provides better interfacial bonding between the matrix and fiber mats and reduces the possible development of voids in the matrix and in stacked layers. It is also evident that ZnO nanofiller help to form the rigid cross-linking chain structure by mechanical interlocking in between the matrix and fibers and impart more improved stiffness and rigidity between the matrix and fiber, and also nanofiller in the interface zones acts as bridges between them. This results in increased load transfer rate interaction between nanofiller, matrix, and fibers63. Further loading of ZnO nanofiller content from 4 to 5 wt%, it is observed that impact strength and absorbed energy were gradually reduced from 2472.50 to 1501.30 J/m and 7.95 to 4.80 J resulting in the reduction of 39.42% of impact strength, while absorbed energy show 39.62%. This reduction was due to high loading content, at such a loading content of 4 to 5 wt%, the surface area to volume for nanofiller in the matrix reduces, this result individual nanofiller start colliding with each other and forms high aspect ratio particles of clusters. These clusters act as barriers to polymer chain mobility structure and disturb the matrix continuity phases in interface zones63. Also, the most important factor is cluster peaks which create imperfect interface bonding in the composites as a result voids are developed in uneven cluster areas. So, cluster phases were responsible for the declined impact strength and absorbed energy at heavy impact loads due to clusters act as crack propagation in the matrix and develop a poor mode of stresses transfer in stacked layers. Overall from the impact results, it is perceived, matrix with higher nanofiller loading (4 & 5 wt%) has typically less capability of impact strength and energy.
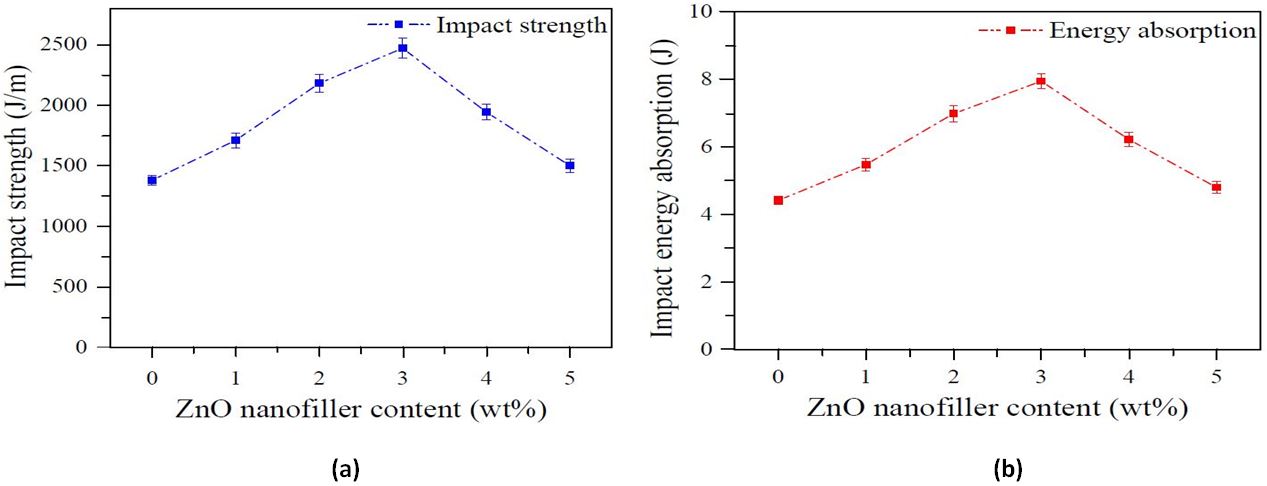
Figure 12. The behavior of impact test results on ZnO nanofiller loading (a) Impact strength (b) Energy absorption.
4.6 Surface microhardness results and analysis
Surface microhardness test results of composites showed increment in the hardness with an increase of nanofiller loading and also microhardness results were not in a similar trend to that of flexural and impact results.
Figure 13 shows the increasing of microhardness of composites with a variation of nanofiller loading (wt%). It is perceived from the nanofiller concentration that, neat resin composite exhibits the lowest microhardness of 19.2 HV with no nanofiller addition. Further, microhardness in composites was substantially increased by 21.6, 24.3, 28.5, 33.7 and 38.4 HV with the incorporation of nanofiller content to composites of 1, 2, 3, 4 and 5 wt% respectively. This improvement from composites was mainly due to gradually decreasing of voids and pores formation with gradually loading of nanofiller to the matrix and also that, matrix become hard with nanofiller content because of nano-particles in matrix restrict the polymer molecules movement under the applied mechanical loads38. It is also evident that as a nanofiller concentration (wt%) gradually increases, the indentation load uptake capacity (absorbed energy capacity) of the composites also increases this is due to inter-laminar distance between the particles in the matrix decreases, so more particles (ZnO) absorbs the applied indentation energy, as this result in composites create more resistance to penetrations and scratches by external loads37,67.
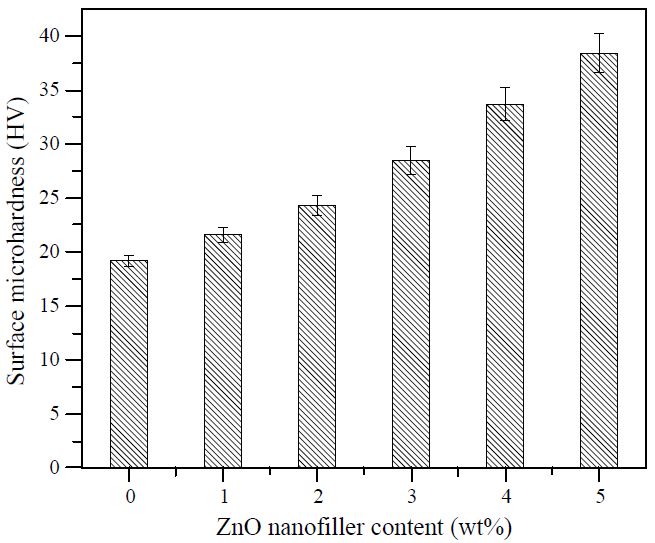
Figure 13. Composites surface microhardness behavior on ZnO nanofiller loading (wt%).
4.7 Thermo-gravimetric test results and analysis (TGA)
The thermo-gravimetric analysis was conducted on composites to identify the composites thermal stability and performance at elevated temperatures. As shown in Figure 14, it explains the stages of weight loss (%) in composites with the function of temperature variations. Characteristic of weight loss (%) in composites according to the function of temperature variations are mentioned in Table 3.
Table 3. Characteristic of weight loss (%) in composites with the function of temperature.
|
Composite ID |
ZnO (wt%) |
Onset (˚C) |
First characteristic weight loss (%) 380˚- 600˚C |
Second characteristic weight loss (%) 600˚- 900˚C |
|
Neat resin |
0 |
380.44 |
48.157 |
7.774 |
|
C1 |
1 |
380.52 |
45.626 |
7.399 |
|
C2 |
2 |
380.83 |
41.113 |
6.956 |
|
C3 |
3 |
381.05 |
36.919 |
5.212 |
|
C4 |
4 |
380.72 |
38.911 |
5.899 |
|
C5 |
5 |
380.38 |
39.763 |
6.712 |
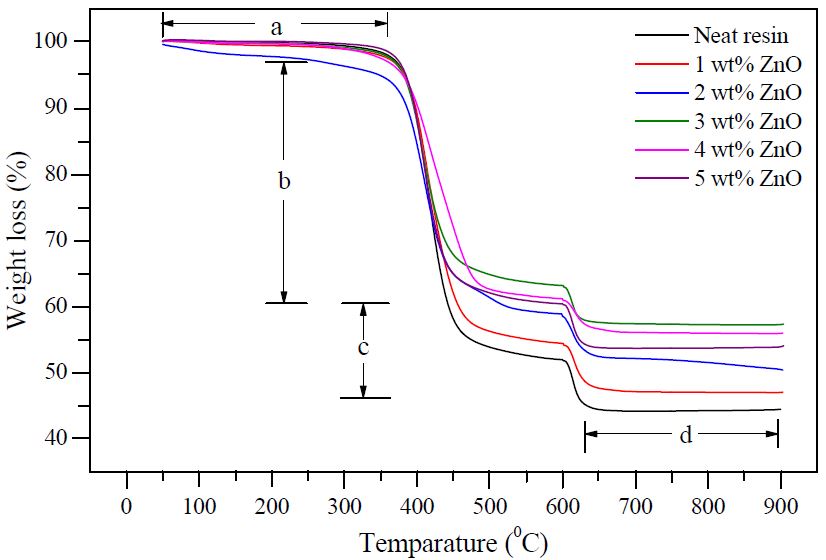
Figure 14. Stages of weight loss (%) in composites with the function of temperature (a) Volatilization (b) Matrix plasticization and dissolution (c) Fiber glass-transition (d) Residue matter (ash).
Initially, in composites, the minute weight loss (2-3%) start with the loss of bound moisture content and volatilization (un-reacted epoxy/hardener compounds, bound gases, and monomers, etc.) from the matrix at the temperature range from 50˚ to 380 ˚C through dehydration process21,67. It is observed that almost every composite had the same degradation curve up to 380 ˚C with almost no weight loss (%). Further, the first characteristic weight loss (%) in composites occur at the temperature range from 380˚ to 600 ˚C. At this temperature range, increasing heat radiation which causes the matrix inside the stacked layers to turn plasticization and dissolution by the de-polymerization effect. This result in changing the microstructure of the composites (matrix and glass fiber microstructures) and also that nanofiller content gradually reduces its adhesive nature with matrix due to plasticization effect, this causes breakdown of polymer backbone cross-link chain structure between the epoxy, hardener, and nanofiller in the matrix, this is seen at temperature range from 380 ˚C to 600 ˚C38. The point at which the composite starts to degrade is called onset degradation point. It is perceived from the first degradation stage that neat resin composite exhibits the highest weight loss of 48.157% with no filler content. Whereas, remaining composites with varying ZnO nanofiller content exhibit the weight loss of 45.626, 41.113, 36.919, 38.911 and 39.763% corresponding to nanofiller content of 1, 2, 3, 4 and 5 wt% respectively. These characteristic trends of weight loss (%) in composites were mainly attributed to the incorporation of ZnO nanofiller. This is maybe due to nanofiller content in the matrix creates more resistance to heat radiation by providing rigid cross-linking chain structures to the matrix. Overall it is observed from the first degradation stage that, weight loss (%) is slightly decreasing with filler content, but for 4 and 5 wt% of reinforcement weight loss (%) start increased by 38.911 and 39.763%. Increased weight loss (%) in composites at 4 and 5 wt% of reinforcement may be due to weakening and breaking of polymer chains (OH groups) because at that wt% reinforcement, ZnO clusters act as barriers to polymer chain mobility structure and breakdown the OH bonding groups with epoxy66. This result in composites reduces its thermal stability in terms of weight loss (%). Thereafter, second characteristic weight loss (%) in composites occur at the temperature range of 600˚ to 900 ˚C, it is identified from the second degradation stage that, neat resin showed the highest weight loss of 7.774%, whereas remaining ZnO filled composites showed the weight loss of 7.399, 6.956, 5.212, 5.899 and 6.712% with nanofiller content of 1, 2, 3, 4 and 5 wt% respectively. The weight loss (%) of composites in the second degradation stage follows a similar trend to that of the first degradation stage. At these elevated temperature stages, the glass fiber reduces its service temperature (above 620 ˚C) and slowly elemental compounds in glass fibers are turns to disappear. It is also evident that increasing heat radiation causes damage to glass fiber and slowly turn to the glass-transition (viscous or rubbery state), finally glass fibers start degradation or decompose completely. Overall, it is observed that the majority of weight loss (%) occur on the first degradation stage (380 ˚C to 600 ˚C) is higher than that of the second degradation stage (600 ˚C to 900 ˚C). At this temperature range (600 ˚C to 900 ˚C) composites possess low weight loss (%) due to the majority of weight loss (%) occur on the first degradation stage. Further, heating composites undergo complete degradation which turns in to residue matter (ash).
5 Summary and conclusions
The present research work was conducted to examine the influence of matrix modification with the addition of ZnO nanofiller to S-glass fiber epoxy composites. Experimental behavior of fabricated composites from surface morphology, physical and mechanical properties was evaluated. Based on composites behavior from experimental test results and analysis the following conclusions are drawn.
Surface morphological images of ZnO nanofiller on resin surface from SEM analysis showed that the presence of 1, 2 and 3 wt% loading the better uniform dispersion was achieved via ultrasonication process on further loading from 4 and 5 wt% uneven clusters were formed on the resin surface due to increased loading content which increases van der Waals interactive forces between the nanofiller.
The void fraction of composites was gradually decreased from 2.760 to 1.641% for the loading content 1 to 3 wt% respectively. Further, void fraction starts increased by 2.696 and 2.833% with loading content of 4 and 5 wt%. This was mainly due to clusters which generate voids in the stacked layers.
The flexural and impact strength in composites shown an effective increment of 694.2 MPa and 2550.42 J/m with an improvement of 41.53 and 44.43 % for 3 wt% ZnO loading. This was due to better interface bonding in the stacked layers and also nanofiller acts as bridges in between the matrix and fibers result in effect load transfer between them. Further loading of 4 and 5 wt%, flexural and impact strength in composites were substantially decreased by 457.3 MPa and 1543.30 J/m with reduction of 34.12 and 39.12 % improvement. This decreased strength was assigned to main clusters of high aspect ratio particles and voids in the matrix and stacked layers.
From surface microhardness test results, it was perceived that there was low significant variation in each composite of 21.6, 24.3, 28.5, 33.7 and 38.4 HV with no hardness reduction obtained by nanofiller addition of 1, 2, 3, 4 and 5 wt% respectively. This was due to increasing wt% more particles absorb energy this creates resistance to external loads. Overall it was identified that, wt% of nanofiller and inter-particulate distance plays a vital role in controlling hardness in composites.
Thermo-gravimetric analysis on composites reveals that they were thermally stable at the temperature range of 50 ˚C to 380 ˚C with an insignificant weight loss (%). Further, increasing temperature (380 ˚C to 900 ˚C), there was significant thermal degradation indicated by major weight loss (%). Decreased weight loss (%) in composites was attributed to volatilization, matrix plasticization, and dissolution through de-polymerization effect. It was concluded that application of these composites was applicable to the temperature below 380 ˚C.
Overall it was observed from the surface morphology, void fraction flexural and impact results, composite with 3 wt% of ZnO nanofiller loading was found to be the best among all the fabricated composites in terms of nanofiller dispersion, strength (flexural/impact) and voids.
The potential applications of S-glass fiber reinforced composite with 3 wt% of ZnO can be used in the aircraft, automotive body parts and boat hulls where the high mechanical loads were acting on the subjected areas, taking the considerations as high-strength to low-weight ratio and corrosion resistance of this S-glass material can be predominantly used in the manufacturing of wind turbine blades and structural beams for the construction applications.
Acknowledgments
The author would like to thank SRM Institute of Science and Technology for accessing research and testing labs.
Notes
The author declared that no conflict of interest.
References
[1] Bunsell AR. Acknowledgments. Handbook of Properties of Textile and Technical Fibres. Elsevier; 2018;xvii. doi:10.1016/b978-0-08-101272-7.04001-3
[2] Thomas S, Kuruvilla J, Malhotra SK, Goda K, Sreekala MS, editors. Polymer Composites. Wiley-VCH Verlag GmbH & Co. KGaA; 2012; doi:10.1002/9783527645213
[3] Kolesov YI, Kudryavtsev MY, Mikhailenko NY. Glass and Ceramics. 2001;58(5):197-202. doi:10.1023/a:1012386814248
[4] Wallenberger FT, Bingham PA, editors. Fiberglass and Glass Technology. Springer US; 2010; doi:10.1007/978-1-4419-0736-3
[5] Miller W., Zhuang L, Bottema J, Wittebrood A., De Smet P, Haszler A, et al. Recent development in aluminium alloys for the automotive industry. Materials Science and Engineering: A. 2000;280(1):37-49. doi:10.1016/s0921-5093(99)00653-x
[6] Mukhopadhyay P. Alloy Designation, Processing, and Use of AA6XXX Series Aluminium Alloys. ISRN Metallurgy. 2012;2012:1-15. doi:10.5402/2012/165082
[7] Koniuszewska AG, Kaczmar JW. Application of Polymer Based Composite Materials in Transportation. Progress in Rubber Plastics and Recycling Technology. 2016;32(1):1-24. doi:10.1177/147776061603200101
[8] Pilato LA, Michno MJ. Advanced Composite Materials. Springer Berlin Heidelberg; 1994; doi:10.1007/978-3-662-35356-1
[9] Textiles and Fashion. Elsevier; 2015; doi:10.1016/c2013-0-17410-7
[10] Rahul R, Kitey R. Effect of cross-linking on dynamic mechanical and fracture behavior of epoxy variants. Composites Part B: Engineering. 2016;85:336-42. doi:10.1016/j.compositesb.2015.09.017
[11] Naebe M, Abolhasani MM, Khayyam H, Amini A, Fox B. Crack Damage in Polymers and Composites: A Review. Polymer Reviews. Informa UK Limited; 2016;56(1):31-69. doi:10.1080/15583724.2015.1078352
[12] Garg AC. Delamination—a damage mode in composite structures. Engineering Fracture Mechanics. 1988;29(5):557-84. doi:10.1016/0013-7944(88)90181-6
[13] Mittal G, Rhee KY, Mišković-Stanković V, Hui D. Reinforcements in multi-scale polymer composites: Processing, properties, and applications. Composites Part B: Engineering. 2018;138:122-39. doi:10.1016/j.compositesb.2017.11.028
[14] Liu F, Deng S, Zhang J. Mechanical Properties of Epoxy and Its Carbon Fiber Composites Modified by Nanoparticles. Journal of Nanomaterials. 2017;2017:1-9. doi:10.1155/2017/8146248
[15] Senthil Kumar MS, Mohana Sundara Raju N, Sampath PS, Vivek U. Tribological analysis of nano clay/epoxy/glass fiber by using Taguchi’s technique. Materials & Design. 2015;70:1–9. doi:10.1016/j.matdes.2014.12.033
[16] Cuppoletti J, editor. Nanocomposites and Polymers with Analytical Methods. InTech; 2011 Aug 9; doi:10.5772/1548
[17] Saba N, Tahir P, Jawaid M. A Review on Potentiality of Nano Filler/Natural Fiber Filled Polymer Hybrid Composites. Polymers. 2014;6(8):2247-73. doi:10.3390/polym6082247
[18] Spectroscopy of Polymer Nanocomposites. Elsevier; 2016; doi:10.1016/c2014-0-03751-3
[19] Khare HS, Burris DL. A quantitative method for measuring nanocomposite dispersion. Polymer. 2010;51(3):719-29. doi:10.1016/j.polymer.2009.12.031
[20] Cesar dos Santos J, Hallak Panzera T, Luiz Christoforo A, de Oliveira Vieira K, Antonio Schiavon M, Antonio Rocco Lahr F. Thermoset Polymer Reinforced With Silica Micro and Nanoparticles. Journal of Testing and Evaluation. ASTM International; 2015 10;44(4):20130331. doi:10.1520/jte20130331
[21] Li W, Li R, Li C, Chen Z, Zhang L. Mechanical properties of surface‐modified ultra‐high molecular weight polyethylene fiber reinforced natural rubber composites. Polymer Composites. 2015;38(6):1215–20. doi:10.1002/pc.23685
[22] Arbaoui J, Moustabchir H, Vigué JR, Royer F-X. The effects of various nanoparticles on the thermal and mechanical properties of an epoxy resin. Materials Research Innovations. 2016;20(2):145-50. doi:10.1179/1433075x15y.0000000026
[23] Sudheer M, Prabhu R, Raju K, Bhat T. Effect of Filler Content on the Performance of Epoxy/PTW Composites. Advances in Materials Science and Engineering. 2014;2014:1-11. doi:10.1155/2014/970468
[24] Prusty RK, Ghosh SK, Rathore DK, Ray BC. Reinforcement effect of graphene oxide in glass fibre/epoxy composites at in-situ elevated temperature environments: An emphasis on graphene oxide content. Composites Part A: Applied Science and Manufacturing. 2017;95:40-53. doi:10.1016/j.compositesa.2017.01.001
[25] Bensadoun F, Kchit N, Billotte C, Trochu F, Ruiz E. A Comparative Study of Dispersion Techniques for Nanocomposite Made with Nanoclays and an Unsaturated Polyester Resin. Journal of Nanomaterials. 2011;2011:1-12. doi:10.1155/2011/406087
[26] Jiang Y, Tohgo K, Shimamura Y. Ultrasonic dispersion of SiO2 particles in glassy epoxy resin. Journal of Composite Materials. 2011 21;46(10):1159-68. doi:10.1177/0021998311413688
[27] Alrekabi S, Cundy A, Lampropoulos A, et al (2016) Experimental investigation on the effect of ultrasonication on dispersion and mechanical performance of multi-wall carbon nanotube-cement mortar composites. Int J Civil Environ Struct Constr Archit Eng 111(3):268-274.
[28] Mahbubul IM, Chong TH, Khaleduzzaman SS, Shahrul IM, Saidur R, Long BD, et al. Effect of Ultrasonication Duration on Colloidal Structure and Viscosity of Alumina-Water Nanofluid. Industrial & Engineering Chemistry Research. 2014;53(16):6677-84. doi:10.1021/ie500705j
[29] Devaprakasam D, Hatton PV, Möbus G, Inkson BJ. Effect of microstructure of nano- and micro-particle filled polymer composites on their tribo-mechanical performance. Journal of Physics: Conference Series. 2008;126:012057. doi:10.1088/1742-6596/126/1/012057
[30] Ahmad FN, Jaafar M, Palaniandy S, Azizli KAM. Effect of particle shape of silica mineral on the properties of epoxy composites. Composites Science and Technology. 2008;68(2):346-53. doi:10.1016/j.compscitech.2007.07.015
[31] Al-Turaif HA. Effect of nano TiO2 particle size on mechanical properties of cured epoxy resin. Progress in Organic Coatings. 2010;69(3):241-6. doi:10.1016/j.porgcoat.2010.05.011
[32] Šupová M,tynková GS, Barabaszová K. Effect of Nanofillers Dispersion in Polymer Matrices: A Review. Science of Advanced Materials. 2011 1;3(1):1-25. doi:10.1166/sam.2011.1136
[33] Wetzel B, Haupert F, Qiu Zhang M. Epoxy nanocomposites with high mechanical and tribological performance. Composites Science and Technology. 2003;63(14):2055–67. doi:10.1016/s0266-3538(03)00115-5
[34] Fu S-Y, Feng X-Q, Lauke B, Mai Y-W. Effects of particle size, particle/matrix interface adhesion and particle loading on mechanical properties of particulate-polymer composites. Composites Part B: Engineering. 2008;39(6):933-61. doi:10.1016/j.compositesb.2008.01.002
[35] Cho J, Joshi MS, Sun CT. Effect of inclusion size on mechanical properties of polymeric composites with micro and nano particles. Composites Science and Technology. 2006;66(13):1941-52. doi:10.1016/j.compscitech.2005.12.028
[36] Singh SK, Singh S, Kohli R, Jain A, Kumar A. Effect of TiO2 dispersion on mechanical properties of epoxy polymer. Author(s); 2016; doi:10.1063/1.4946637
[37] Pawar MJ, Patnaik A, Nagar R. Investigation on mechanical and thermo-mechanical properties of granite powder filled treated jute fiber reinforced epoxy composite. Polymer Composites. 2015 9;38(4):736-48. doi:10.1002/pc.23633
[38] Prasad V, Joseph MA, Sekar K. Investigation of mechanical, thermal and water absorption properties of flax fibre reinforced epoxy composite with nano TiO2 addition. Composites Part A: Applied Science and Manufacturing. 2018 Dec;115:360-70. doi:10.1016/j.compositesa.2018.09.031
[39] Biswas S. Mechanical properties of bamboo-epoxy composites a structural application. Advances in materials Research. Techno-Press; 2012;1(3):221-31. doi:10.12989/amr.2012.1.3.221
[40] Eslami-Farsani, R., Khosravi, H. On the flexural properties of multiscale nanosilica/E-glass/epoxy anisogrid-stiffened composite panels. Journal of Computational & Applied Research in Mechanical Engineering. 2017; 7(1): 99-108. doi:10.22061/jcarme.2017.638
[41] Sivasaravanan S, Bupesh Raja VK, Manikandan Impact characterization of epoxy LY556/E-Glass Fibre/Nano clay hybrid nano composite materials. Procedia Eng, 2014; 97:968-974. doi:10.1016/j.proeng.2014.12.373
[42] Singh AK, Siddhartha, Deepak. Assessment of mechanical and three-body abrasive wear peculiarity of TiO2- and ZnO-filled bi-directional E-glass fibre-based polyester composites. Bulletin of Materials Science. Springer Science and Business Media LLC; 2016 Jul 21;39(4):971-88. doi:10.1007/s12034-016-1237-4
[43] Singh SK, Singh S, Sharma S, Sharma V. Strength Degradation of Mechanical Properties of Unidirectional E- Glass Fiber Epoxy Resin Nanoclay Composites under Hygrothermal Loading Conditions. Procedia Materials Science. 2014;5:1114-9. doi:10.1016/j.mspro.2014.07.405
[44] Krushnamurty K, Rasmitha D, Srikanth I, et al. Effect of volume fraction of fibre on the mechanical properties of nanoclay reinforced E-glass-epoxy composites. Int J Chem Mol Nucl Mater Metall Eng; 2016; 10(1):98-101. doi:10.5281/zenodo.1111687
[45] Srivastava VK. Fatigue life of E-glass fibre/zirconia/epoxy hybrid composites. Bulletin of Materials Science. Springer Science and Business Media LLC; 1988 May;10(3):251-5. doi:10.1007/bf02744071
[46] Wang J, Chen R, Xiang L, Komarneni S. Synthesis, properties and applications of ZnO nanomaterials with oxygen vacancies: A review. Ceramics International. 2018 May;44(7):7357-77. doi:10.1016/j.ceramint.2018.02.013
[47] Ghaleb ZA,iatti M, Ariff ZM. Properties of graphene nanopowder and multi-walled carbon nanotube-filled epoxy thin-film nanocomposites for electronic applications: The effect of sonication time and filler loading. Composites Part A: Applied Science and Manufacturing. 2014;58:77-83. doi:10.1016/j.compositesa.2013.12.002
[48] Subramanian MN. Polymer Blends and Composites. John Wiley & Sons, Inc.; 2017 3; doi:10.1002/9781119383581
[49] Applied Plastics Engineering Handbook. Elsevier; 2017; doi:10.1016/c2014-0-04118-4
[50] Reactive Polymers: Fundamentals and Applications. Elsevier; 2018; doi:10.1016/c2017-0-01641-5
[51] Dorofeev GA, Streletskii AN, Povstugar IV, Protasov AV, Elsukov EP. Determination of nanoparticle sizes by X-ray diffraction. Colloid Journal. 2012;74(6):675-85. doi:10.1134/s1061933x12060051
[52] Xueshu LIU, Fei CHEN A review of void formation and its effects on the mechanical performance of carbon fiber reinforced plastic. 2016; 64(1):33-51. http://et.ippt.gov.pl/index.php/et/article/view/280
[53] Das G, Biswas S. Physical, Mechanical and Water Absorption Behaviour of Coir Fiber Reinforced Epoxy Composites Filled With Al2O3 Particulates. IOP Conference Series: Materials Science and Engineering. 2016;115:012012. doi:10.1088/1757-899x/115/1/012012
[54] Agwa MA, Megahed M, Megahed AA. Enhancement of water barrier properties and tribological performance of hybrid glass fiber/epoxy composites with inclusions of carbon and silica nanoparticles. Polymers for Advanced Technologies. 2017;28(9):1115-24. doi:10.1002/pat.4004
[55] R. KAUNDAL, A. PATNAIK, and A. SATAPATHY, Effect of SiC Particulate on Short Glass Fiber Reinforced Polyester Composite in Erosive Wear Environment. Walailak Journal of Science and Technology. 2012;9(1):49-64. http://wjst.wu.ac.th/index.php/wjst/article/view/206
[56] Bindu P, Thomas S. Estimation of lattice strain in ZnO nanoparticles: X-ray peak profile analysis. Journal of Theoretical and Applied Physics. 2014;8(4):123-34. doi:10.1007/s40094-014-0141-9
[57] Prabhu YT, Rao KV, Kumar VSS, Kumari BS. X-Ray Analysis by Williamson-Hall and Size-Strain Plot Methods of ZnO Nanoparticles with Fuel Variation. World Journal of Nano Science and Engineering. 2014;04(01):21-8. doi:10.4236/wjnse.2014.41004
[58] De Almeida SFM, Neto Z dos SN. Effect of void content on the strength of composite laminates. Composite Structures. 1994;28(2):139-48. doi:10.1016/0263-8223(94)90044-2
[59] Sarkar P, Modak N, Sahoo P. Mechanical Characteristics of Aluminum Powder Filled Glass Epoxy Composites. International Journal of Engineering and Technologies. 2017;12:1-14. doi:10.18052/www.scipress.com/ijet.12.1
[60] Mehdikhani M, Gorbatikh L, Verpoest I, Lomov SV. Voids in fiber-reinforced polymer composites: A review on their formation, characteristics, and effects on mechanical performance. Journal of Composite Materials. 2018;53(12):1579-669. doi:10.1177/0021998318772152
[61] Hamidi YK, Aktas L, Altan MC. Effect of Nanoclay Content on Void Morphology in Resin Transfer Molded Composites. Journal of Thermoplastic Composite Materials. 2008;21(2):141-63. doi:10.1177/0892705707083635
[62] Nayak RK, Mahato KK, Ray BC. Water absorption behavior, mechanical and thermal properties of nano TiO2 enhanced glass fiber reinforced polymer composites. Composites Part A: Applied Science and Manufacturing. 2016;90:736-47. doi:10.1016/j.compositesa.2016.09.003
[63] Hulugappa B, Achutha MV, Suresha B. Effect of Fillers on Mechanical Properties and Fracture Toughness of Glass Fabric Reinforced Epoxy Composites. Journal of Minerals and Materials Characterization and Engineering. 2016;04(01):1-14. doi:10.4236/jmmce.2016.41001
[64] Nayak RK, Ray BC. Influence of seawater absorption on retention of mechanical properties of nano-TiO2 embedded glass fiber reinforced epoxy polymer matrix composites. Archives of Civil and Mechanical Engineering. 2018;18(4):1597-607. doi:10.1016/j.acme.2018.07.002
[65] Michler GH, von Schmeling H-HK-B. The physics and micro-mechanics of nano-voids and nano-particles in polymer combinations. Polymer. 2013;54(13):3131-44. doi:10.1016/j.polymer.2013.03.035
[66] Ammar S, Ramesh K, Vengadaesvaran B, Ramesh S, Arof AK. Amelioration of anticorrosion and hydrophobic properties of epoxy/PDMS composite coatings containing nano ZnO particles. Progress in Organic Coatings. 2016;92:54-65. doi:10.1016/j.porgcoat.2015.12.007
[67] Gull N, Khan SM, Munawar MA, Shafiq M, Anjum F, Butt MTZ, et al. Synthesis and characterization of zinc oxide (ZnO) filled glass fiber reinforced polyester composites. Materials & Design. 2015;67:313-7. doi:10.1016/j.matdes.2014.11.021
Open Access
This article is licensed under a Creative Commons Attribution 4.0 International License. (http://creativecommons.org/licenses/by/4.0/), which permits unrestricted use, distribution, and reproduction in any medium, provided you give appropriate credit to the original author(s) and the source, provide a link to the Creative Commons license, and indicate if changes were made.
© The Author(s) 2019